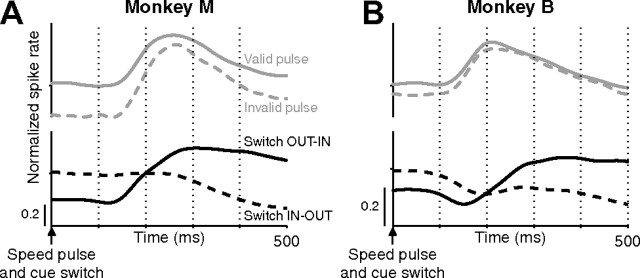
Figure 11.
A comparison of the time course of the speed-pulse response and attentional shift after a cue switch. Average neural response after a speed pulse (gray top curves) and after a cue switch (black bottom curves) are shown for the LIP populations in monkey M (A) and monkey B (B). Neural activity was normalized as in Figure 8. y-Axis tick denotes a normalized spike rate of 1. The neural response to the speed pulse and postcue attentional shift occur on a similar timescale.

