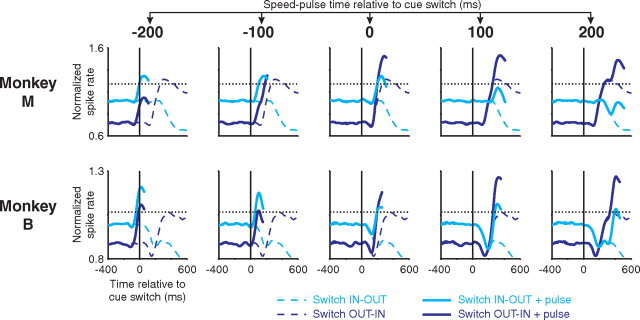
Figure 12.
Summation model of the interaction between the speed-pulse response and attentional shift. The interaction was modeled by adding the baseline-subtracted, validly cued, LIP speed-pulse response (correct and missed trials combined) to the peri-switch neural response from LIP. The peri-switch neural responses (dotted lines) and peri-switch responses plus speed-pulse response (solid lines) are shown. The best thresholds from Figure 10, A and B, are also shown as horizontal dotted lines. The speed-pulse response was shifted with respect to the cue switch to simulate the speed-pulse occurring at one of five times: −200, −100, 0, 100, and 200 ms. The shape of the added speed-pulses response is most clearly evident in the leftmost column (−200 ms) in which it has been added to the flat, pre-switch baseline. As the speed-pulse response occurs later, it combines with the evolving attentional modulation resulting in higher peak activity and earlier threshold crossing for the switch OUT–IN + pulse activity. For details, see Materials and Methods and Results.

