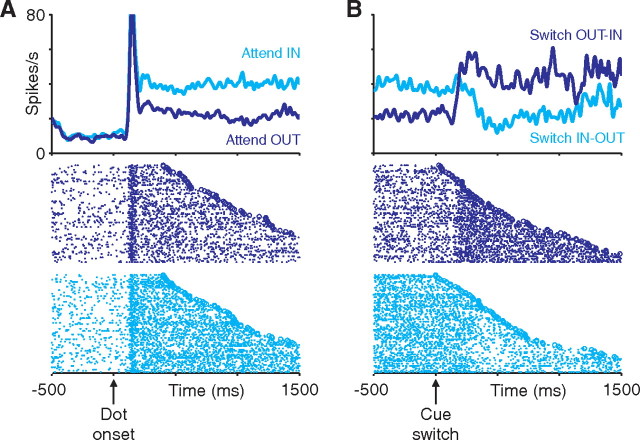
Figure 4.
Responses of a single LIP neuron. Left panels show peristimulus time histograms (PSTHs) and corresponding single-trial rasters for non-switch trials, aligned on the initial onset of the moving dots. Right panels show PSTHs and corresponding single-trial rasters for switch trials, aligned on the cue switch. Neural activity is shown separately depending on whether the trial began with the cued stimulus in the receptive field (cyan) or out of the receptive field (blue). In the raster plots, trials are arranged based on the time of the speed pulse (open symbols), with shorter to longer times arranged from top to bottom. For clarity, only trials in which the cue switch occurred >700 ms after dot onset are shown. Data from each trial were averaged into the PSTHs only up until the time of the speed pulse on that trial. Single-trial responses were smoothed by convolving with a Gaussian (SD of 20 ms) before averaging.

