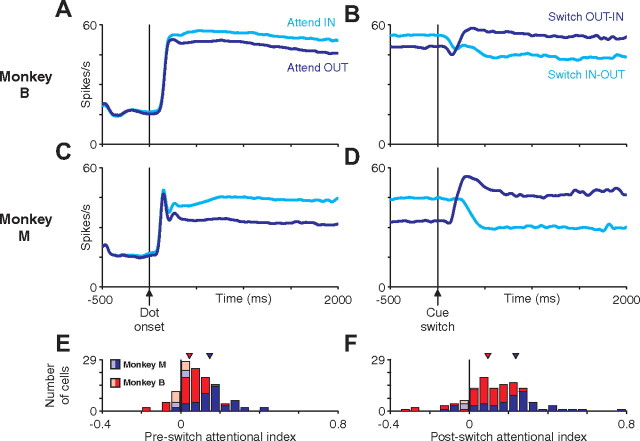
Figure 5.
Average LIP activity aligned on dot onset or cue switch. A–D, Average LIP population firing rate aligned on dot onset (A, C) or cue switch (B, D) for monkey M (A, B) or monkey B (C, D). Averages were calculated across all single trials for all neurons recorded (55 cells for monkey M, 63 cells for monkey B). Average activity when the initially cued dot patch was in the receptive field (cyan) or out of the receptive field (blue) are plotted separately. The modulation of attention is relatively constant throughout a trial but switches shortly after a cue switch. E, F, The impact of attention on the neural response of single neurons was quantified using an AI (see Materials and Methods). Histograms depict the distribution of AI values for monkey M (blue) and monkey B (red). Neurons with an AI significantly different from 0 (p < 0.05 by permutation test, see Materials and Methods) are shown as dark bars and remaining neurons as light bars.

