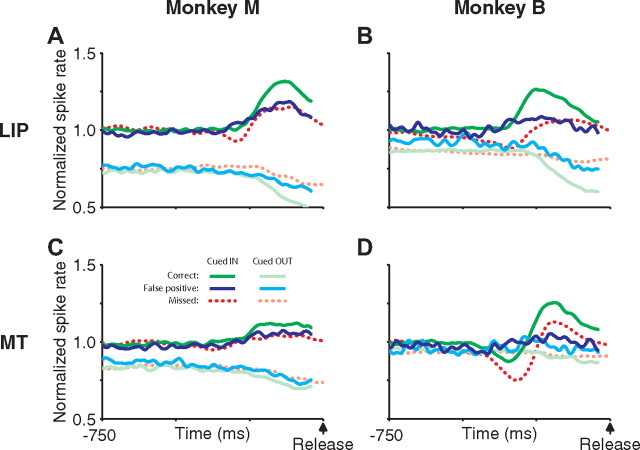
Figure 9.
Neural activity in LIP and MT preceding false-positive reactions. A–D, Population neural activity aligned on the time of false-positive reactions for LIP (A, B) and MT (C, D), shown separately for monkey M (A, C) and monkey B (B, D). Responses are split based on whether the dot patch in the receptive field was cued at the time of the false-positive response or not (blue or cyan, respectively). For comparison, the activity before correct reactions to validly cued speed pulses in (green) and out (light green) of the receptive field are also shown. Last, we plotted the neural activity from validly cued missed trials for speed pulses in (dashed red) and out (dashed light red) of the receptive field. Because missed trials did not have a reaction on which to align, the neural activity was aligned to the time of the speed pulse and then shifted by the monkey's mean reaction time to align with the other curves. Changes in the neural activity preceding false-positive reactions were dramatically different depending on whether the receptive field dot patch was cued at the time of the reaction. This activity, although smaller in magnitude, was generally similar to that preceding correct responses. Neural activity was normalized as for Figure 8.

