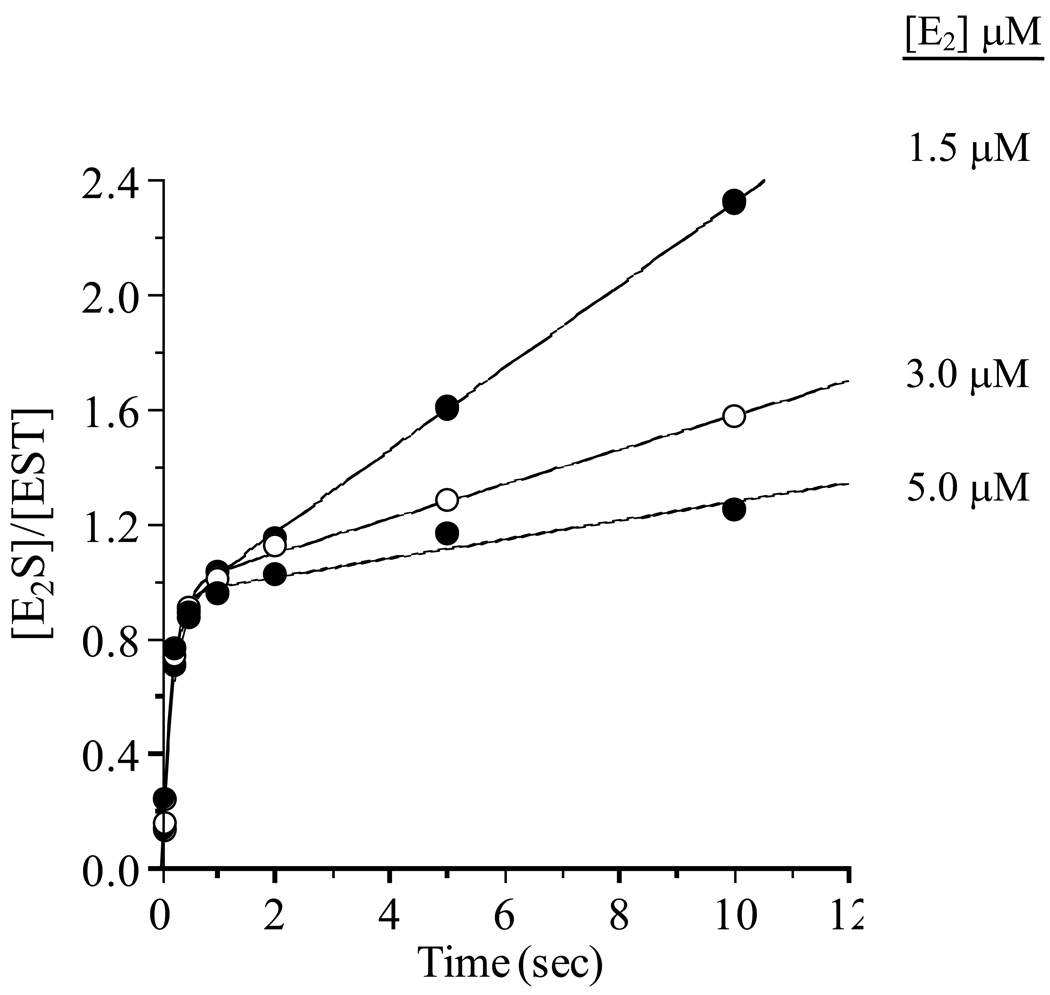
Figure 4. The effect of E2 inhibition on the E2S burst.
Reactions were initiated by rapidly mixing a solution containing PAPS (18.0 µM), MgCl2 (7.0 mM), DTT (1.0 mM), glycerol (10% v/v), and 50 mM KPO4 (pH 6.3) with an equal volume of an identical solution that did not contain PAPS, but did contain EST (1.0 µM) and various concentrations of [3H]E2 (3.0, 6.0, 10.0 µM). Quenching and product quantitation are described in the Figure 1 Legend (also, see Materials and Methods). Measurements were performed in triplicate and averaged. All solutions were equilibrated at 25 (± 2) °C prior to mixing. Solid lines through the data represent the behavior predicted by the best-fit parameters obtained from a non-linear least-squares fit of the parameterized form of Equation 2 to the data, see Results and Discussion.

