
Figure 6. Colocalization of calcium-binding proteins and 5-HT2CR in layer IV of the PrL.
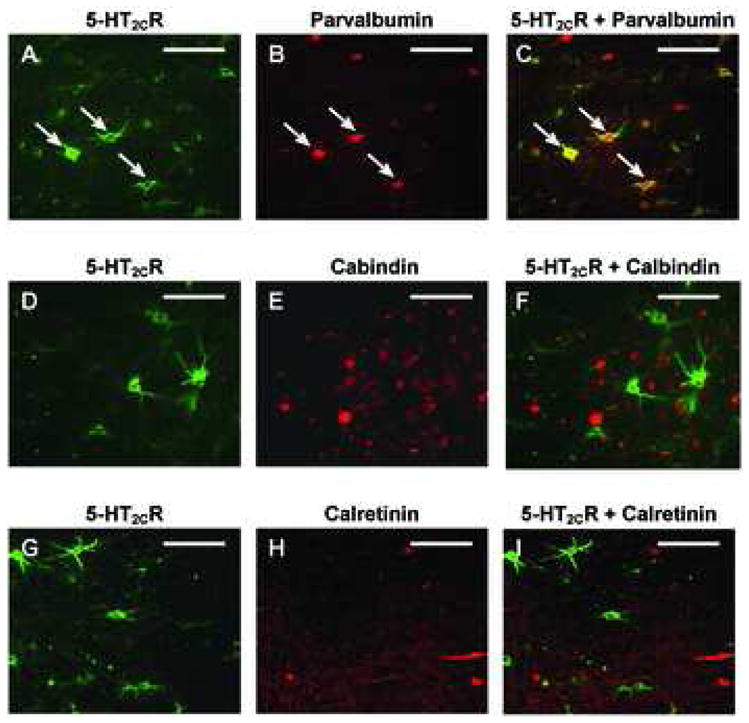
In all cases, the 5-HT2CR-IR is demonstrated by Alexa Fluor® 488 (green, A, D, G), and parvalbumin-, calbindin-, and calretinin are demonstrated by Alexa Fluor® 555 staining (red, B, E, H, respectively). Figures C, F and I display the overlay of images in A+B, D+E and G+H, respectively. Of the three classes of interneurons, double-labeled parvalbumin cells tended to express the greatest degree of 5-HT2CR-IR. Arrows show the cells with both parvalbumin-IR and 5-HT2CR-IR. All images were taken from the same area as depicted in Figure 5D. Scale bar: 100 μm.