
Figure 8. Number of parvalbumin-, calbindin-, and calretinin-positive cells in the rat PrL that co-express 5-HT2CR-IR.
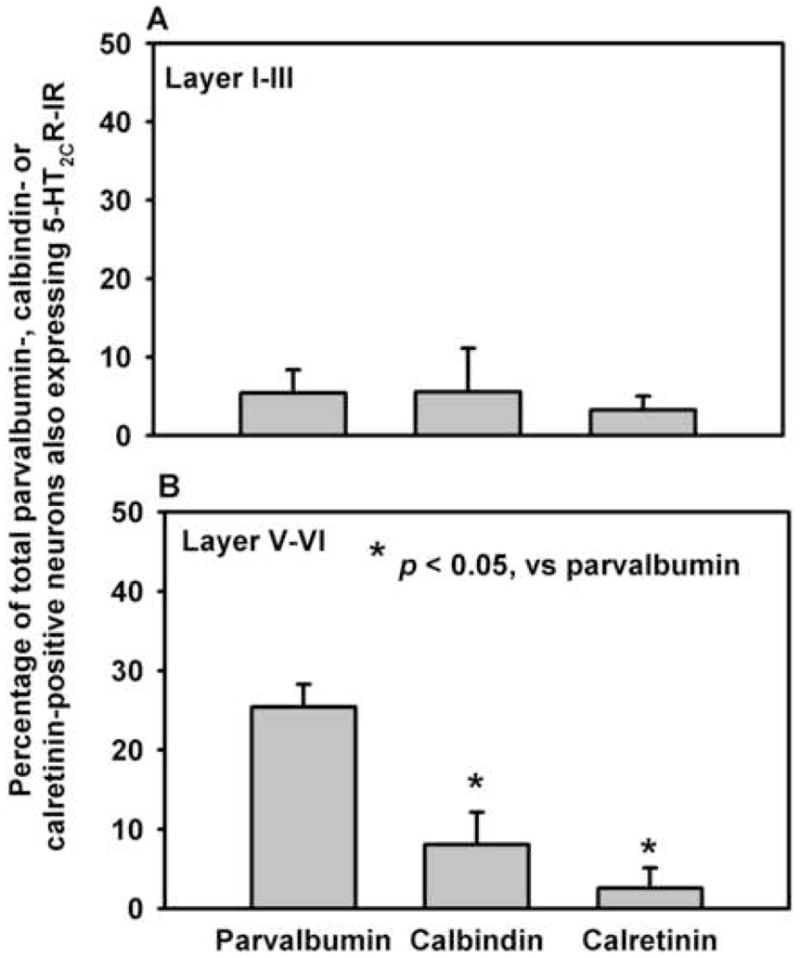
Interneuron populations were defined by IR staining for parvalbumin, calbindin, or calretinin. The average of the percentage of total cells detected for each interneuron subpopulation that also contained 5-HT2CR-IR (± S.E.M.) is presented (n = 3 rats). The percentage of calretinin or calbindin-positive cells which express 5-HT2CR-IR is significantly lower (p < 0.05) than the number of parvalbumin-positive cells in the deep layers (layers V/VI; B) but not the superficial layers (layers I–III; A) of the PrL.