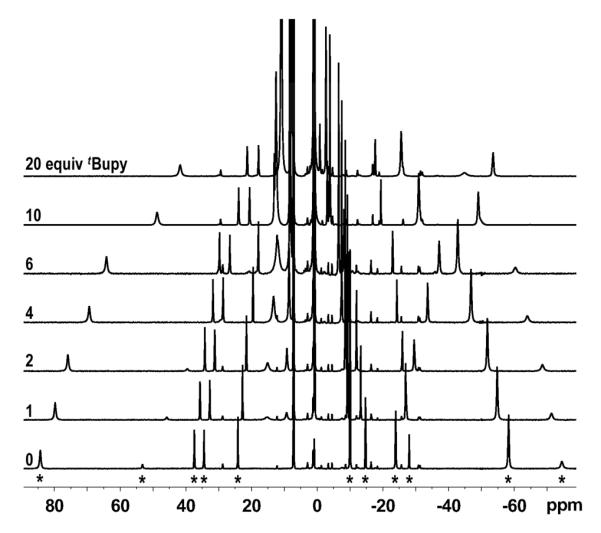
Figure 3.

1H NMR spectra of 2 (C6D6, 25 °C) at the specified concentrations of tBupy. The eleven peaks assigned to 2 (marked with *) are indicated in the bottom spectrum. The small peaks with δH independent of [tBupy] are due to trace contamination with the iron-tetrazene complex 5.
