Fig. 1.
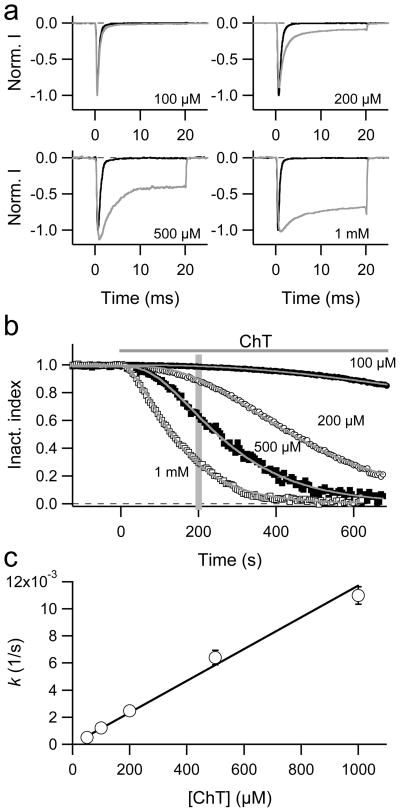
a–c Effect of ChT on the inactivation of NaV1.4 channels in HEK 293 cells. a Current responses to depolarisations to −10 mV before (black) and 200 s after (grey) application of the indicated ChT concentration. b Superposition of inactivation index data from representative experiments in which the indicated concentration of ChT was applied at time zero. The superimposed curves are fits according to Eq. (3) with an exponent set to 2. The vertical grey bar indicates 200 s, i.e. the time from which the current traces in a were selected. c The time constants determined from fits as in panel b were transformed to rate constants (k = 1/τ) and plotted as a function of the ChT concentration. The error bars indicate SEM values (n = 4–11). The straight line is the result of a linear fit with a slope of 11.7 ± 0.5 (sM)−1.

