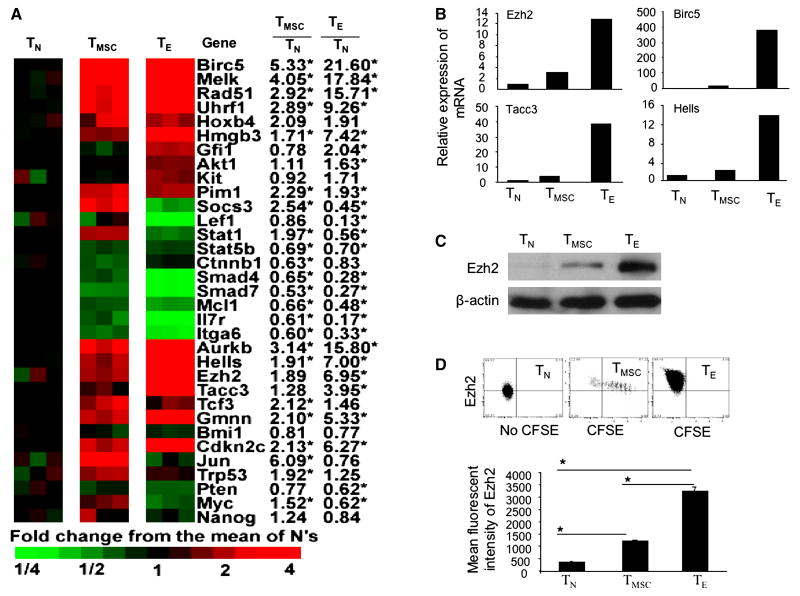
Fig.5.
Characterization of stem cell genes in alloreactive CD8+ T cells. (A) The relative expression of stem cell genes in alloreactive CD8+ TE and CD8+ TMSC are shown with genes identified by functional set enrichment analysis using curated gene lists from MSigDBv2 (Fig.4). (B) Real-time RT-PCR analysis shows the relative mRNA expression of selected genes in each T cell subset. Data are representative of three independent preparations of alloreactive T cells. (C) Western blot analysis shows the expression of EZH2 protein in purified day-14 CD8+ TE, TMSC and control TN. (D) donor CD8+ TN and day-14 CD8+ T cells were stained with anti-Ezh2 Ab using intracellular staining and analyzed by flow cytometry. Dot plots show the expression of Ezh2 in cell subset of donor T cells. Mean fluorescent intensity shows the amount of testing antigen.

