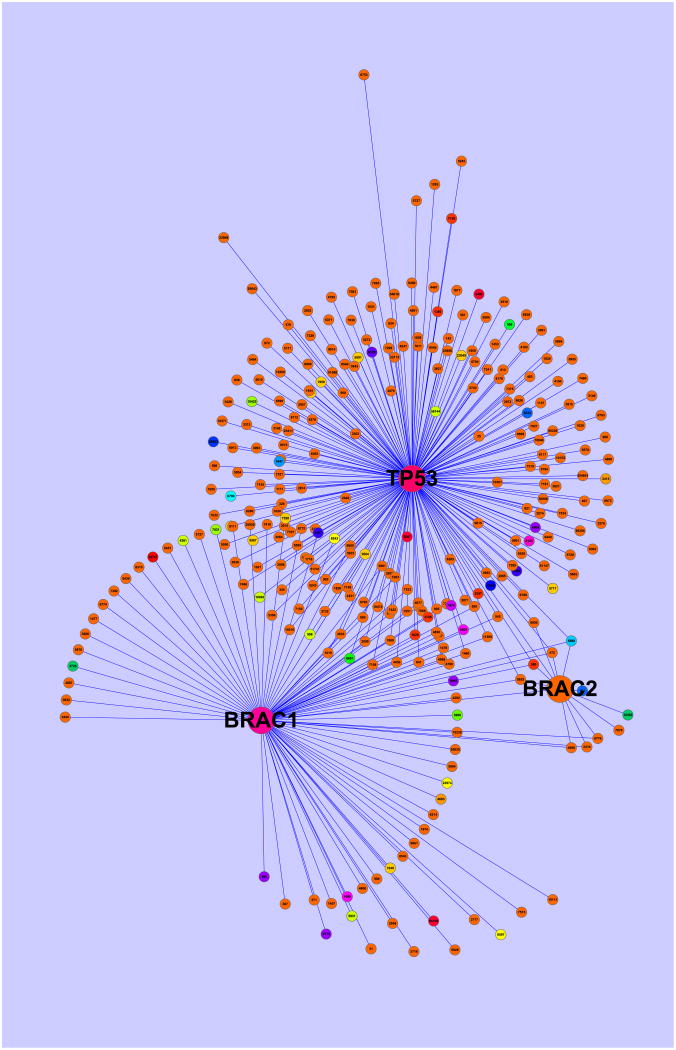
Figure 3.
Plot of the PPI subnetwork for the metastasis data, as described by an undirected graph with 294 nodes and 326 edges. Three regulating genes TP53, BRACA1 and BRACA2 are represented by large nodes. There are 27 estimated groups colored over the color spectrum with dark color corresponding to small estimated group regression coefficients. The plot is produced in Cytoscape.

