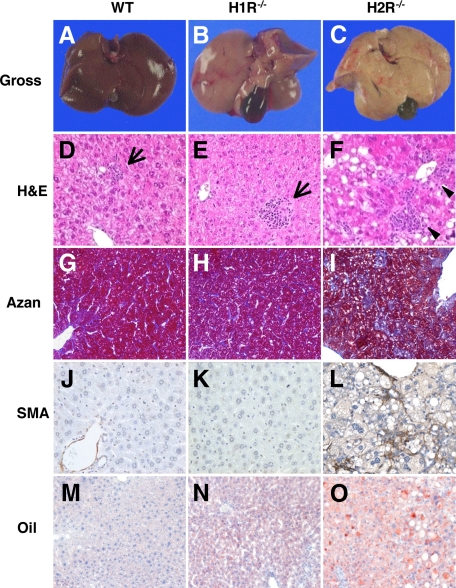
Figure 5.
Hepatic steatosis and inflammation after 6-week HcD. A–C, Gross appearance of the liver from mice fed HcD. The liver from H2R−/− mice is pale in color. D–L: Representative photomicrographs showing hepatic inflammation, fibrosis, and hepatic stellate cell activation in mice fed HcD for 6 weeks. Livers from wild-type (D) and H1R−/− (E) mice show scattered lobular inflammation (arrows), whereas livers from H2R−/− mice (F) show severe lobular and perivenular inflammation (arrowheads). Pericellular fibrosis (Azan-Mallory stain, I) and α-SMA-positive stellate cells (L) are evident in livers from H2R−/− mice. No fibrosis and α-SMA-positive stellate cells are noted in wild-type (G and J) and H1R−/− mice (H and K). M–O: Representative photomicrographs showing lipid accumulation after six weeks of HcD feeding. The wild-type liver shows very few and small deposits of lipid in hepatocytes (M) and increased numbers of lipid droplets are evident in H1R−/− hepatocytes (N). Macrovesicular steatosis throughout the entire lobules is apparent in the liver from H2R−/− mice (O). Oil-red O stain.

