
Figure 7.
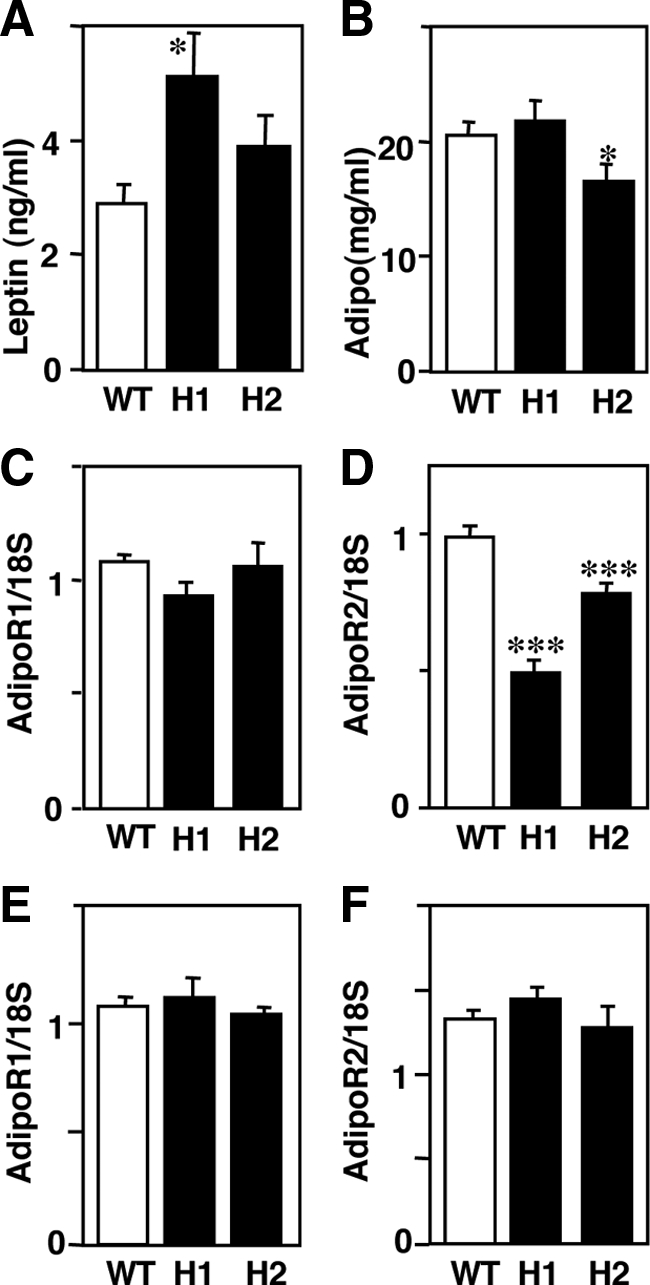
Expression of leptin, adiponectin and AdipoR in mice fed with HcD for 12 weeks. Blood leptin levels in H1R−/− mice are increased (A), and blood adiponectin levels are decreased in H2R−/− mice (B). C and D: Expression of AdipoRs in the liver. AdipoR1 expression was not different in the liver (C) but AdipoR2 expression was significantly decreased in both KO mice (D). E and F: Expression of AdipoRs in skeletal muscle. There was no difference in expression of AdipoR1 or AdipoR2 between wild-type and KO mice. *P < 0.05 and ***P < 0.001 versus wild-type mice. WT, wild-type; H1, H1R−/−; H2, H2R−/− mice.