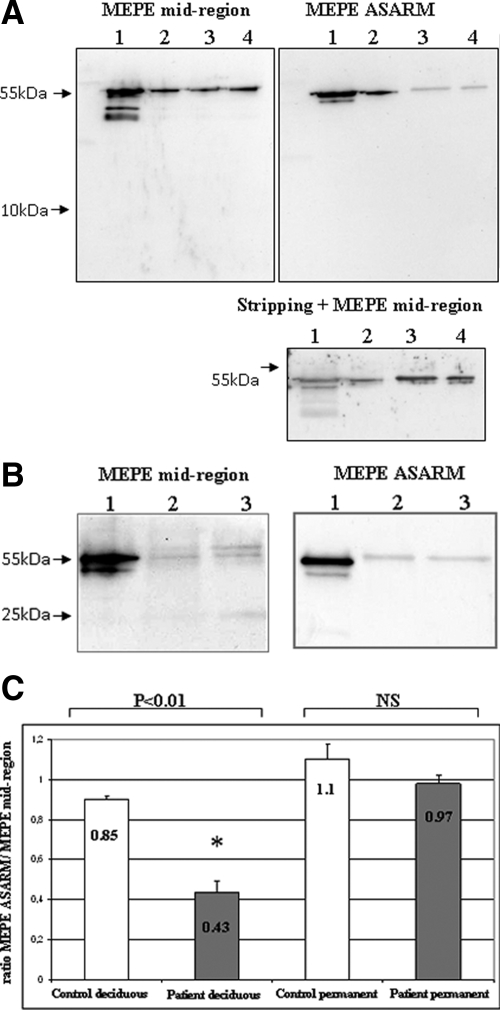
Figure 1.
Western blot analysis of dentin extracts with MEPE antibodies after 12% SDS-PAGE. A: MEPE appears as a band at 55 kDa in deciduous dentin extracts of similar intensity for control and hypophosphatemic samples with the MEPE mid-region antibody In contrast, a decrease in the band intensity is observed for hypophosphatemic samples with the ASARM antibody compared with control samples. Stripping and hybridization of this membrane with MEPE mid-region antibody confirms that the protein loading was correct. No difference is observed between vital and necrotic hypophosphatemic samples. Lane 1, recombinant MEPE (positive control); lane 2, control dentin; lane 3, vital hypophosphatemic dentin (patient 1); lane 4, necrotic hypophosphatemic dentin (patient 2). B: MEPE appears as a double band at 55 kDa in permanent dentin extracts with mid-region antibody and as a single band with ASARM antibody. A faint band is visualized in control and hypophosphatemic samples at approximately 25 kDa with MEPE mid-region antibody. No difference is observed between patient and control samples with both antibodies. Lane 1, recombinant MEPE; lane 2, control dentin; lane 3, hypophosphatemic dentin (patient 7). C: Quantification of Western blots using ImageJ software. Results are presented as ratios (mean ± SD) between the band of the MEPE-ASARM/MEPE mid-region intensities for both control and hypophosphatemic patients. Significant difference (*P < 0.01). Control deciduous teeth, n = 6; hypophosphatemic deciduous teeth, n = 6; control permanent teeth, n = 4; hypophosphatemic permanent teeth, n = 4.

