Figure 4.
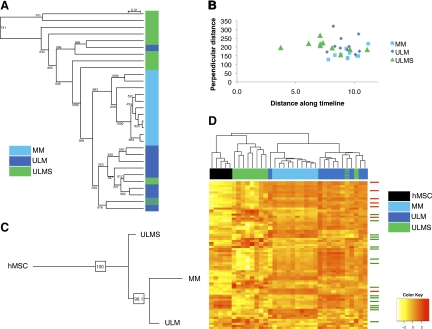
Phylogenetic and clustering analyses of SM tumor subtypes using miRNA profiles. A: Cluster analysis of ULMS, ULM, and MM samples (n = 10 each) based on their miRNA expression profiles. Note that miRNAs are able to accurately segregate benign and malignant uterine mesenchymal lesions. B: Distance analysis of ULMS, ULM, and MM along a timeline based on SM miRNA signature. C: Consensus tree derived from phylogenetic analysis of ULMS, ULM, and MM tissues, rooted by hMSC samples. D: Unsupervised clustering analysis of five hMSC samples along with ULMS, ULM, and MM tissue samples based on the expression of the ‘classifier list’ of miRNAs differentially expressed between the three tissue subtypes. Green and blue hash marks (4A and D) represent a ULMS case that was misclassified and later found to be ULM-like. Arrows indicate SM differentiation signature miRNAs (red: up-regulated miRNAs, green: down-regulated miRNAs).

