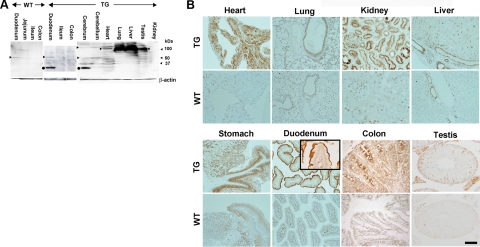
Figure 2.
Protein levels of SLC11A2 transgenic mice. A: Western blot analysis of SLC11A2. Arrowheads show the position of recognized major bands. Scraped duodenal mucosa and lysates from cerebrum, heart, lung, liver, and testis in TG showed intense bands, although the bands appeared at different molecular weights with or without smear. Duodenal mucosa from WT also showed a faint band (arrowhead). There was much difficulty in this procedure because of the presence of 12 membrane-spanning domains in SLC11A2. Closed circle, possible proteolytic product. Refer to Materials and Methods and Discussion sections for details. B: Immunohistochemical analysis of SLC11A2. Many kinds of parenchymal cells showed positivity. Immunostaining was most intense at the apical membrane of the duodenum. Kupffer cells and bile ducts, but not hepatocytes, showed positivity. Refer to the Results section for details (Scale bar = 100 μm in organs other than lung and testis; Scale bar = 200 μm in lung; and Scale bar = 50 μm in the duodenal inset and testis).

