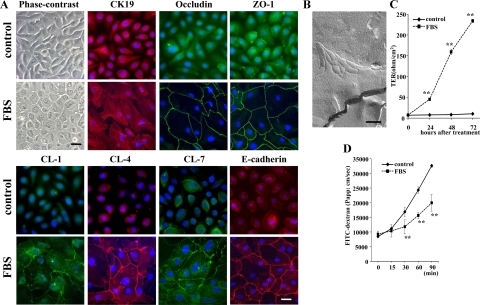
Figure 3.
A: Phase-contrast images and immunocytochemical analysis for CK19, occludin, ZO-1, claudin-1, -4, and -7, and E-cadherin in hTERT-HPDE cells at 24 hours after treatment with 10% FBS compared with the control. In FBS-treated cells, the cytoplasm is increased compared with the control and CK19 is expressed as in the control. Lines of occludin, ZO-1, claudin-1, -4, and -7, and E-cadherin are observed at cell borders in FBS-treated cells, whereas they are not detected at cell borders in the control. Black bar = 40 μm; White bar = 20 μm. B: Freeze-fracture replica of hTERT-HPDE cells at 24 hours after treatment with 10% FBS. A network composed of several continuous tight junction strands is observed at subapical membranes. Scale bar = 200 nm. Barrier function measured as TER (C) and paracellular flux using FITC-dextran (D) in hTERT-HPDE cells after treatment with 10% FBS. The value of TER gradually increased until 72 hours after treatment with 10% FBS, whereas in the control, it was still very low at 72 hours. The paracellular flux of FITC-dextran was significantly decreased at 24 hours after treatment with 10% FBS. CL, claudin. **P < 0.01.

