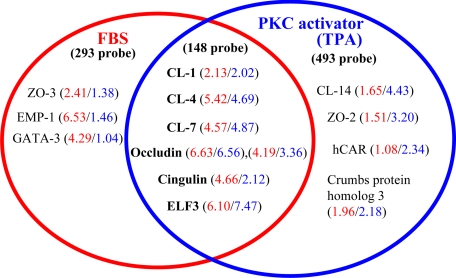
Figure 8.
GeneChip analysis of hTERT-HPDE cells at 24 hours after treatment with 10% FBS or 100 nmol/L TPA. Up-regulated gene probes associated with tight junction molecules are shown in the Venn diagram. The 148 probes that were up-regulated in both FBS- and TPA-treated cells contained claudin-1, -4 and -7, occludin, cingulin, and ELF3. The 293 probes that were up-regulated only in FBS-treated cells contained ZO-3 and EMP-1, and the 493 probes that were up-regulated only in TPA-treated cells contained claudin-14, ZO-2, hCAR, and crumbs protein homolog 3. The fold changes of each probe are depicted in red for FBS-treated cells and in blue for TPA-treated cells. CL, claudin.

