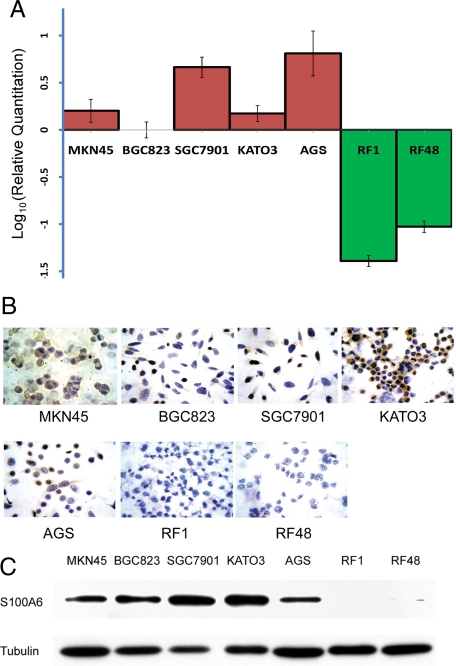
Figure 4.
The expression of S100A6 in the gastric cancer cell lines. A: Quantitative assessment (Log10 value) of S100A6 mRNA levels by real-time PCR in BGC823, SGC7901, KATO3, AGS, MKN45, RF1, and RF48 cell lines, each sample was run thrice, SD are shown. B: Immunocytochemical staining of S100A6 in gastric cancer cell lines (×400). C: The S100A6 protein expression in gastric cancer cell lines by Western blot.

