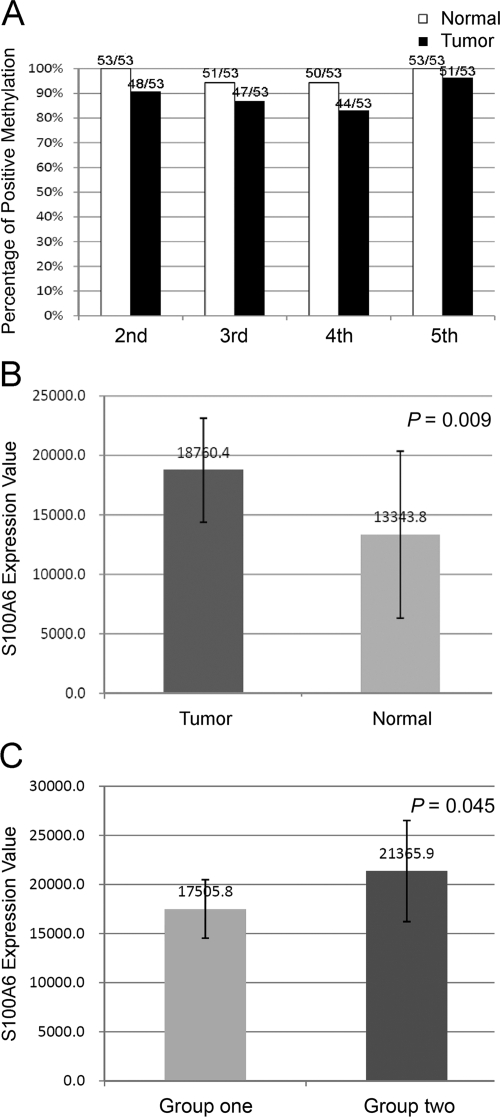
Figure 6.
Methylation status of CpG sites in the gastric cancer and nonneoplastic mucosa. A: Percentage of positive methylation in the second to fifth CpG sites of E2/I2 region in paired gastric cancer and nonneoplastic mucosa. B: Average S100A6 expression value of 46 gastric cancer tissues and 20 nonneoplastic mucosa. Error bars indicate SD. C: The expression difference of S100A6 between group one and group two. Group one: cancer tissues with the second to fifth sites of the E2/I2 region entirely methylated; group two: cancer tissues with at least a single CpG site of this region unmethylated. Error bars indicate SD.

