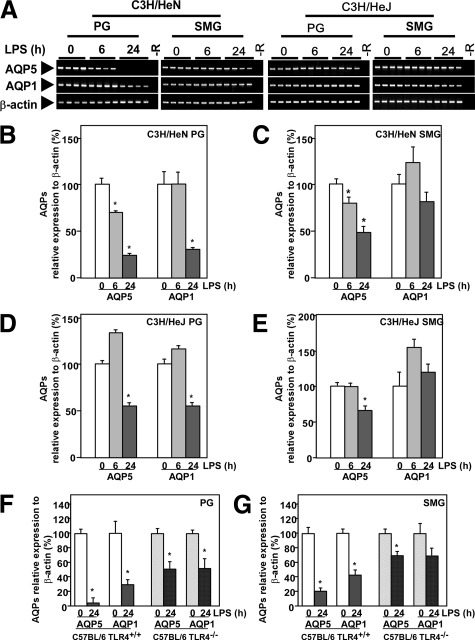
Figure 1.
Effects of LPS on expression of AQP5 and AQP1 mRNAs in the PG and SMG. A: Agarose electrophoresis of RT-PCR products. −R indicates no added RNA. B–G: mRNA analysis by real-time RT-PCR. A–E: Analysis of mRNA prepared from C3H/HeN and C3H/HeJ mice. F and G: Analysis of mRNA prepared from C57BL/6 (TLR4+/+) and C57BL/6 (TLR4−/−) mice. Data are presented as the mean ± SE of 4 mice. *P < 0.05, significantly different from the control (0 hours).

