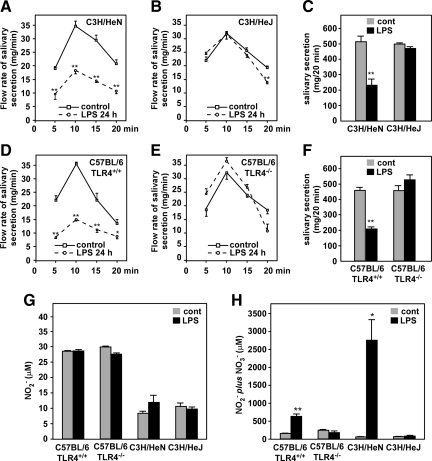
Figure 3.
Effects of LPS on salivary secretion and production of serum NO2−/NO3− in C3H/HeN, C3H/HeJ, C57BL/6 (TLR4+/+), and C57BL/6 (TLR4−/−) mice. A–F: Pilocarpine-provoked salivary secretion. Solid line indicates control (non LPS-treated group); dashed line, LPS-treated group. Upper graphs, C3H/HeN and C3H/HeJ mice; lower graphs, C57BL/6 (TLR4+/+) and C57BL/6 (TLR4−/−) mice. A, B, D, and E: Time course of salivary secretion. C and F: Total salivary secretion (0–20 minutes after LPS treatment); A–C: C3H/HeN and C3H/HeJ mice. D–F: C57BL/6 (TLR4+/+) and C57BL/6 (TLR4−/−) mice. G and H: Serum NO2− and NO2− plus NO3− levels in C3H/HeN, C3H/HeJ, C57BL/6 (TLR4+/+), and C57BL/6 (TLR4−/−) mice before and after LPS injection. G: NO2− levels. H: Levels of NO2− plus NO3−. Data are presented as the mean ± SE of 4 mice. *P < 0.05 and **P < 0.01, significantly different from control at the same time points.

