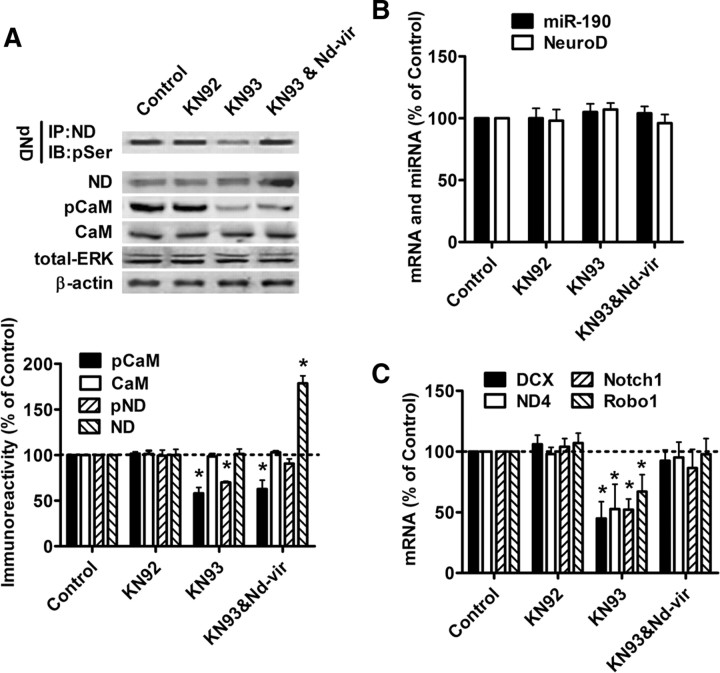
Figure 3.
NeuroD activity correlates with its phosphorylation by CaMKIIα. Primary cultures were treated with PBS (control), KN92 (2 μm), KN93 (2 μm), or KN93 (2 μm) plus nd-vir for 3 d. A, The amount of phosphorylated NeuroD (pND), total NeuroD (ND), total CaMKIIα (CaM), phosphorylated CaMKIIα (pCaM), total ERK, and β-actin were determined as in Figure 1A. B, The levels of miR-190 and NeuroD mRNA were measured by real-time PCR. C, The mRNA levels of DCX, ND4, Notch1, and Robo1 were determined with real-time PCR. A–C, Results were normalized against those in control samples. IP, Immunoprecipitation; IB, immunoblotting. Error bars indicate SD. *p < 0.05.

