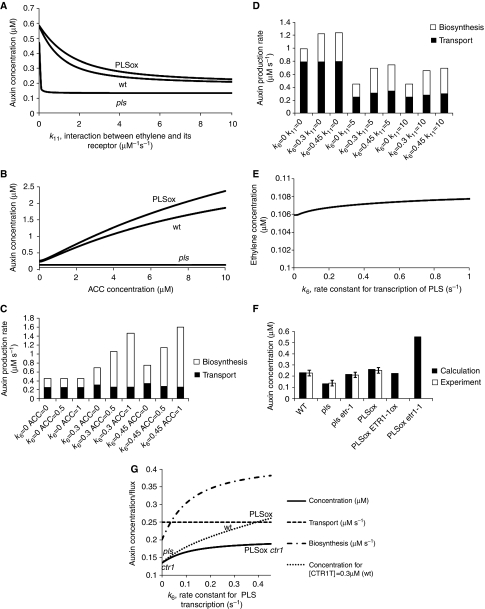
Figure 5.
PLS-mediated control of auxin concentration. (A) Effects of both PLS transcription and interaction of ethylene with its receptor on auxin concentration; (B) effects of both exogenous ACC and PLS transcription on auxin concentration. In pls mutant, auxin concentration decreases from 0.14 to 0.12 μM as exogenous ACC concentration increases from 0 to 10 μM. (C) Effects of both exogenous ACC and PLS transcription on auxin transport and biosynthesis; (D) effects of both PLS transcription and interaction of ethylene with its receptor on auxin transport and biosynthesis; (E) effects of PLS transcription on endogenous ethylene concentration; (F) filled bar: modelling results; unfilled bar: experimental measurements (Chilley et al, 2006). wt: k6=0.3 s−1; k11=5 μM−1 s−1; pls: k6=0.0 s−1; k11=5 μM−1 s−1. pls etr1-1: k6=0.0 s−1; k11=0.03 μM−1 s−1. PLSox: k6=1.0 s−1; k11=5 μM−1 s−1. PLSox ETR1-1ox: k6=0.45 s−1; k11=10 μM−1 s−1. PLSox etr1-1: k6=0.45 s−1; k11=0.03 μM−1 s−1. (G) Analysis of the effects of both CTR1 and PLS transcription. Auxin concentration for total CTR1 concentration to be 0.3 μM (wt) is also included for comparison.

