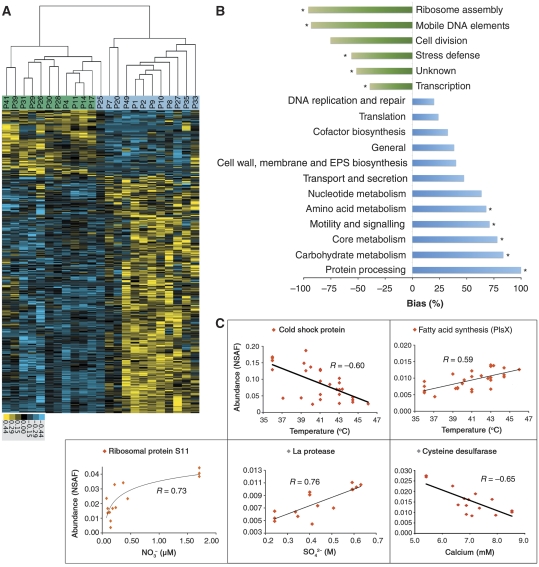
Figure 4.
Correlations of proteins of Leptospirillum Group II with environmental factors. (A) Clustering of samples using abundance values of differentially detected proteins (significance analysis of microarrays with a false-discovery rate <0.05) of Leptospirillum Group II (474 proteins, see Supplementary Table S4 for the complete list of proteins). Column labels signify sample names and green and blue highlights represent expression group designation from Figure 2. (B) Functional differences of Leptospirillum Group II between developmental stages. Values represent the bias in total proteins overrepresented in either high or low developmental stages. Positive values (blue bars) signify categories overrepresented in high developmental stage biofilms and negative values (green bars) signify categories overrepresented in low developmental stage biofilms. Asterisks note categories significantly overrepresented (98% confidence interval). (C) Pairwise scatter plots of measurements of selected environmental factors strongly correlated to the abundances of a given protein. Source data is available for this figure at www.nature.com/msb.

