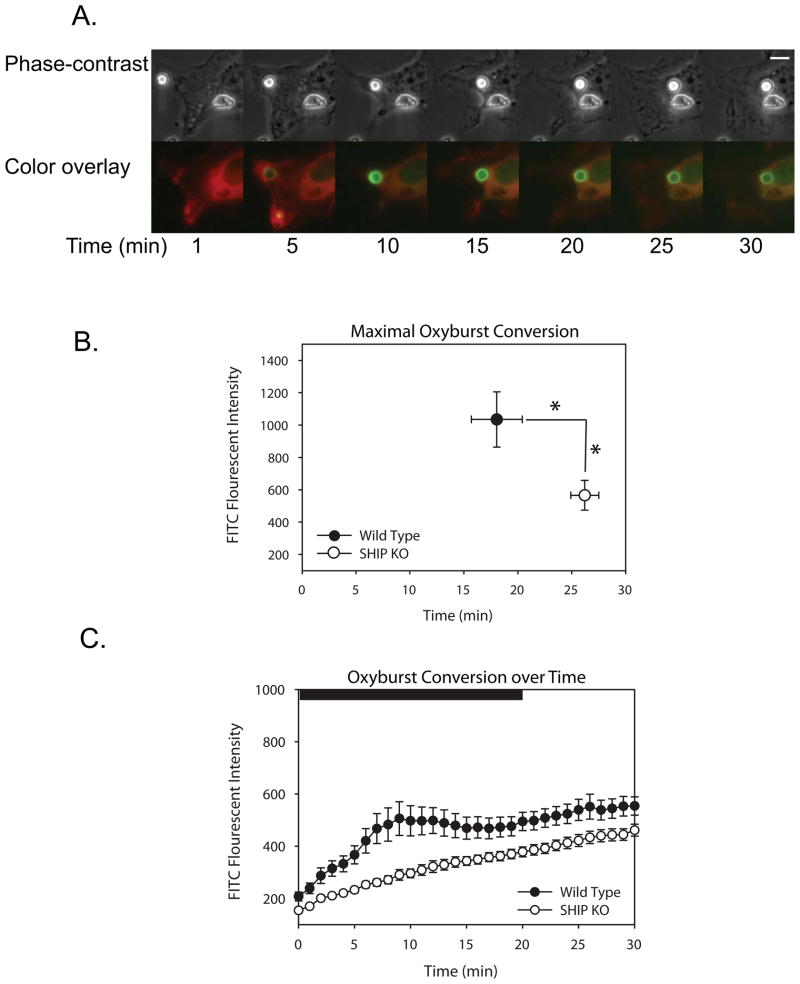
Figure 2.
Characterization of the early oxidative burst in wild-type or SHIP1−/− macrophages. Oxyburst-conjugated, IgG-opsonized beads were fed to wild-type or SHIP1−/− macrophages expressing β actin-mCherry and the increases in oxyburst fluorescence were recorded at regular intervals. (A) Phase-contrast and Overlay images of a wild-type macrophage undergoing phagocytosis of particles. Actin is pseudocolored red, oxyburst is pseudocolored green. Scale bar in the Phase-contrast image corresponds to 5 μm. (B) The maximal oxyburst fluorescence produced on the beads was plotted vs. the time of peak fluorescence for wild-type (n=20) or SHIP1−/− (n=27) macrophages. Asterisks indicate significance (p-value < 0.05) for both the difference in peak fluorescence intensity and time of peak fluorescence. (C) The level of oxidase activity, as indicated by the rise in fluorescence intensity, was averaged over time in multiple phagosomes from wild-type (n=15) or SHIP1−/− (n=25) macrophages and plotted. Bar indicates Student’s t-test for significant differences. Black bar corresponds to time points with significantly different fluorescence (p-value < 0.05).

