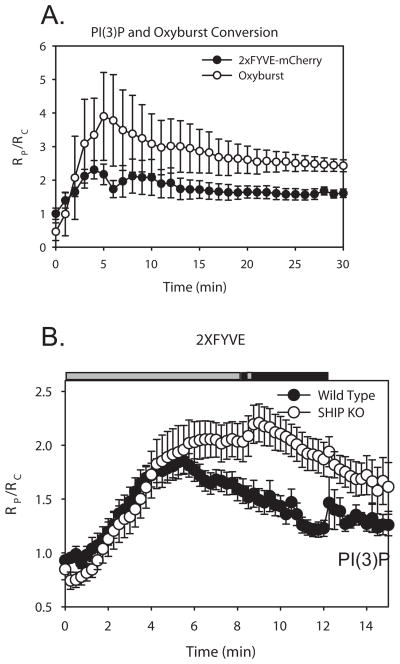
Figure 4.
Dynamics of PI(3)P and oxyburst conversion during phagocytosis in macrophages. (A) Plot of RP/RC depicting the increase in PI(3)P levels (FYVE-mCherry) and oxidase activation (Oxyburst) vs. time during phagocytosis (n=5). Error bars represent SEM. (B) PI(3)P dynamics in wild-type (black circles, n=13) and SHIP1−/− (white circles, n=9) macrophages expressing 2xFYVE-CIT and CFP. Plot of RP/RC indicates the dynamics of 2xFYVE-CIT during phagocytosis of IgG-opsonized erythrocytes. Horizontal bars indicate Student’s t-test for significant differences. Grey bars indicate p-value > 0.05, black bars indicate data with p-value < 0.05.

