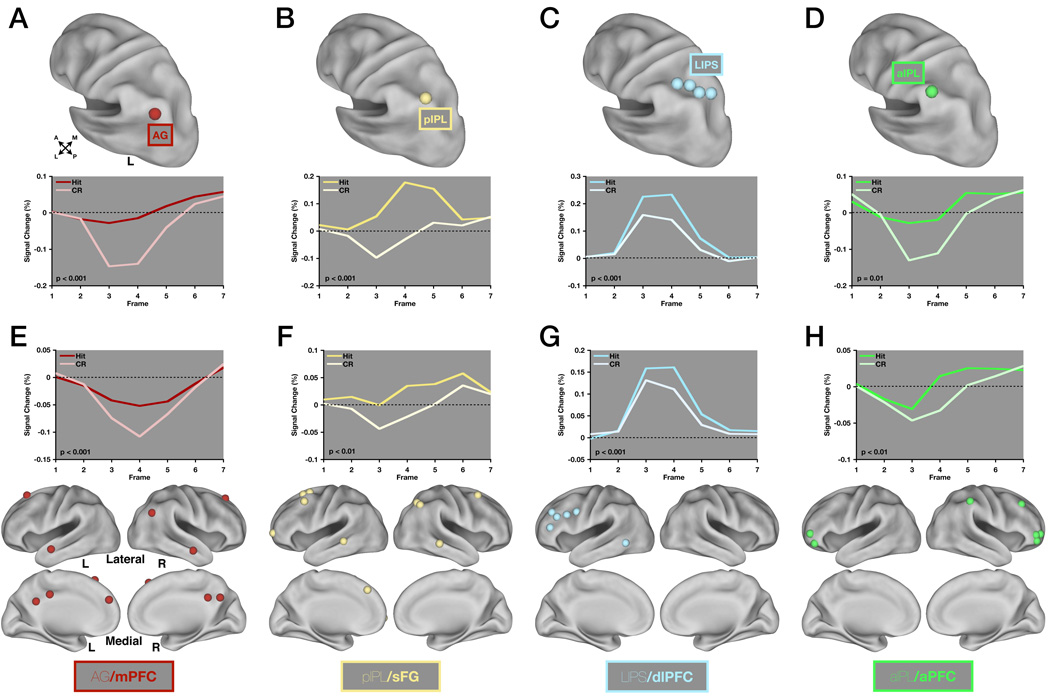
Figure 7. Four rs-fcMRI derived sub-modules show different task-evoked fMRI timecourse dynamics and retain retrieval success effects independent of the LLPC ROIs.
(A) A region in angular gyrus (AG) is shown on a lateral view of the left hemisphere using Caret software. Timecourses (below) were extracted for hits and correct rejections across the eight studies that comprised the meta-analysis. P-values represent the significance of the difference between hits and correct rejections determined by a response × time repeated measures ANOVA with 2 levels of response and 7 levels of time.
(B), (C), and (D) Same as in (A) but for pIPL (B), LIPS (C) and aIPL (D).
(E) All ROIs in the AG/mPFC sub-module excluding AG are shown on lateral and medial views of the cortex using Caret software. Timecourse data was extracted as in (A) but is averaged across all ROIs shown here. P-values are same as in (A).
(F), (G), (H) Same as in (E) but for pIPL/sFG (F), LIPS/dlPFC (G), and aIPL/aPFC (H).

