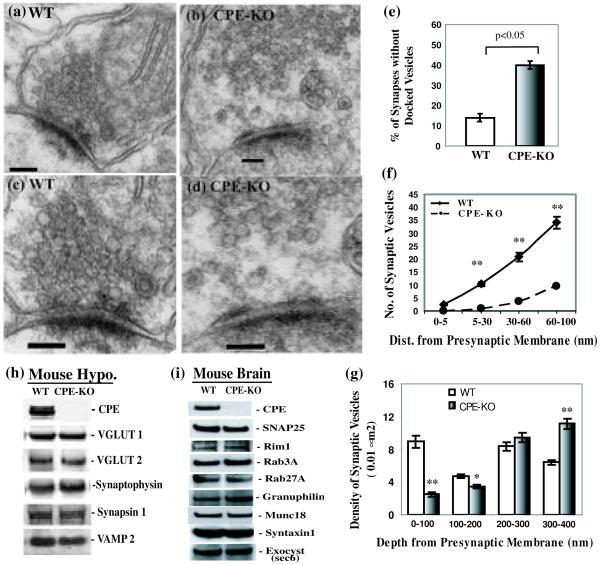
Fig. 2.
Comparison of hypothalamic synapse morphology between wild type (WT) and CPE-KO (KO) mice. Representative electronic micrograph (EM) of hypothalamic synapses from WT (a) and CPE-KO mice (b) (Scale bar = 100 nm). Magnified EM images of hypothalamic synapses from WT (c) and CPE-KO (d) mice (Scale bar = 100 nm). (e) Bar graph showing the percentage of synapses without tethered/docked synaptic vesicles at active zone of the presynaptic membrane in the hypothalami of CPE-KO mice (N=123) was significantly higher than that of their WT littermates (N=134). (f) Line graph showing the number of synaptic vesicles within the zone 5, 30, 60, 100 nm away from the presynaptic membrane (depth) and entire area along side of the post synaptic density (width) of the CPE-KO (N=40) and WT mouse synapses (N=40). (g) The average density of SVs per 100 nm × 100 nm (0.01 μm2) between 0-100, 100-200, 200-300, and 300-400 nm from the presynaptic membrane from 26 boutons of CPE KO mice and WT littermates. * p<0.05; ** p<0.0002. (h) Representative Western blot showing the levels of proteins associated with synaptic vesicle in the hypothalamus (Hypo.) of CPE knock out (KO) mouse or their wild type littermates (WT). (i) Immunoblots demonstrate the levels of proteins related with synaptic vesicle tethering/docking in the brain cytosol of CPE KO mouse or their wild type littermates (WT). All experiments were repeated three times with similar results.

