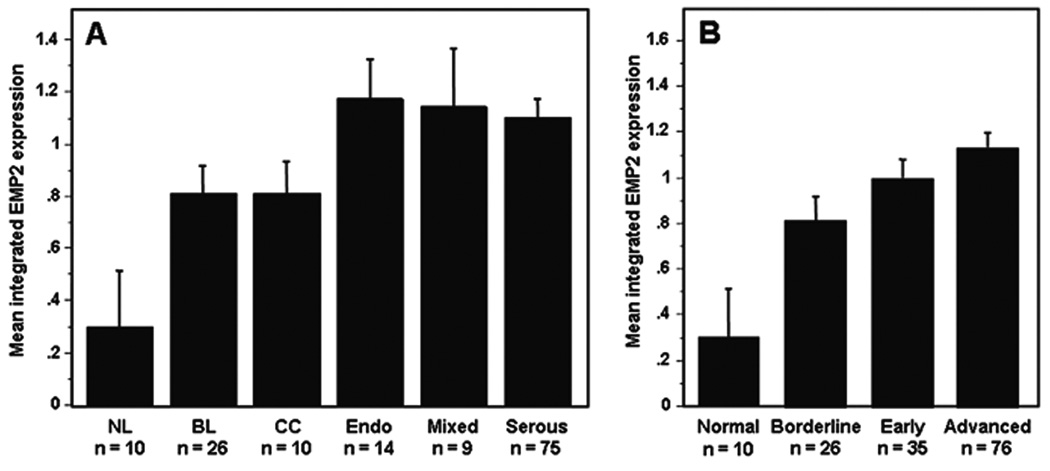
Figure 1. EMP2 expression stratified by histologic type and stage.
The mean integrated intensity of EMP2 protein expression for each category is shown using bar plots. The error bars represent the standard error of the mean; n is number of sample. (A) EMP2 expression was significantly increased in borderline (BL, P = 0.0088), clear cell (CC, P = 0.0233), endometriod (Endo, P = 0.0025), mixed (P = 0121), and serous (P = 0.0003) compared to non-malignant normal ovarian epithelium. (B) EMP2 expression was significantly higher in borderline (P = 0.0088), early stage (P = 0.0021) and advance stage tumors (P = 0.0003) compared to non-malignant normal ovarian epithelium. There was a trend towards higher EMP2 expression from borderline to early to advance stage tumors, however, these differences were not statistically significant.

