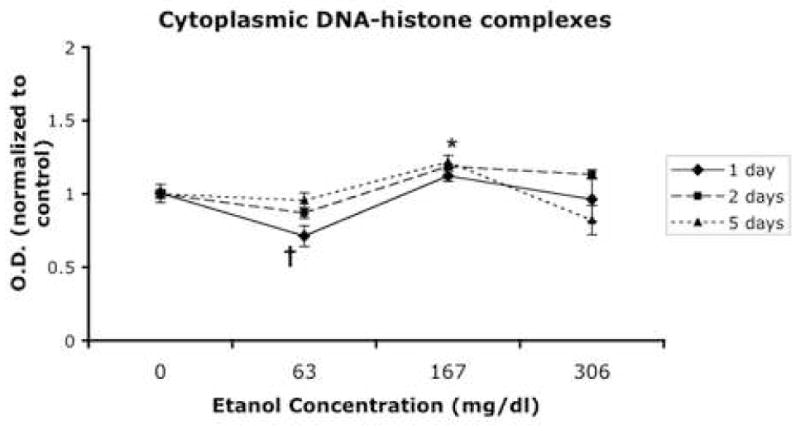
Fig. 3.

DNA fragmentation as measured by enzyme-linked immunosorbent assay (ELISA) observed after a 1, 2, and 5 days exposure. The y axis represents optical density normalized to controls. The † symbol indicates an overall statistically significant suppression compared to controls (LSD post-hoc p<0.004) at the low dose of ethanol, while * indicates an overall statistically significant induction compared to controls (LSD post-hoc p<0.002) at the moderate ethanol dose. The high ethanol dose was not statistically different from controls (LSD post-hoc p<0.581). All error bars represent S.E.M.
