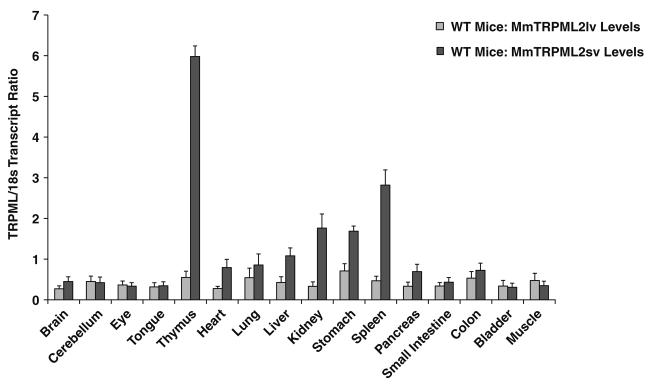
Fig. 1.
Real-time QPCR analyses of mouse (Mm) TRPML2lv and TRPML2sv from organs and tissues of wild type (WT) mice. The transcript ratio of TRPML2lv were very low compared with TRPML2sv. The transcript ratio of TRPML2sv showed a tissue-specific expression pattern with normalized values markedly higher in lymphoid (thymus and spleen) and kidney organs followed by heart, lung, liver, and stomach. Data are represented as means ± SEM, N=6 wild-type mice. The samples were processed and analyzed as described in the Materials and methods section

