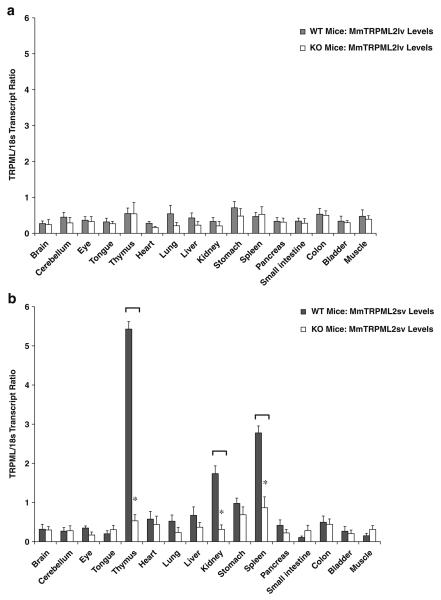
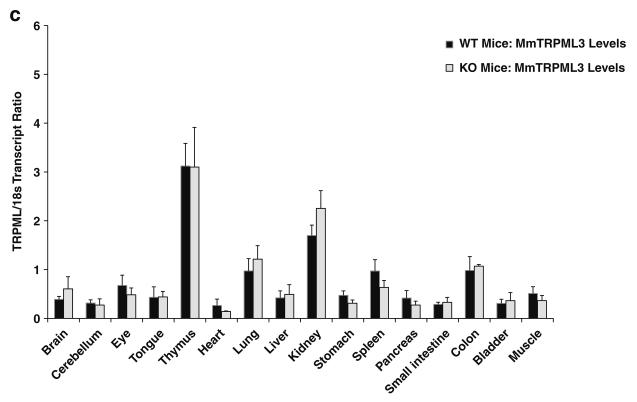
Fig. 3.
Real-time QPCR analyses of a TRPML2lv, b TRPML2sv, and c TRPML3 mRNA expression levels from various organs and tissues taken from TRPML1−/− null mice and their wild-type littermates. In a, TRPML2lv transcript levels consistently showed low transcript ratio across all samples obtained from both TRPML1−/− mice and wild-type littermates. In b, TRPML2sv levels exhibited a predominantly tissue-specific expression in wild-type but were significantly reduced in lymphoid and kidney organs of TRPML1−/− mice. In c, TRPML3 transcripts showed a similar tissue-specific distribution pattern, although no significant changes were observed in TRPML3 transcript levels between TRPML1−/− mice and wild-type littermates. Real-time QPCR analyses were performed as described in the Materials and methods section. Data are represented as means ±SEM, N=6 TRPML1−/− mice, and N=6 wild-type mice. *p<0.005, Student's t-test, two-tailed


