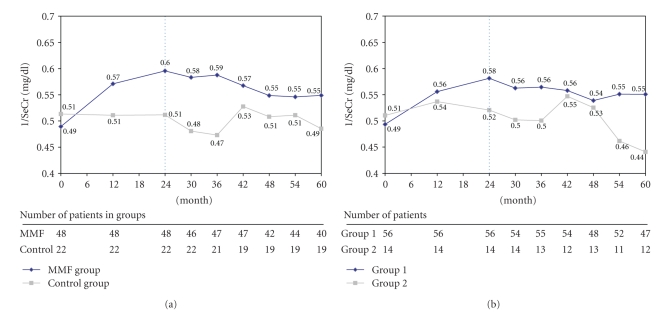
Figure 3.
(a) Evolution of inverse of creatinine (1/SeCr) over time in the randomization population (MMF group versus control group). (b) Evolution of inverse of creatinine (1/SeCr) over time in the on-treatment population (group I versus group II). The vertical, dotted line separates initial study phase and follow up phase.

