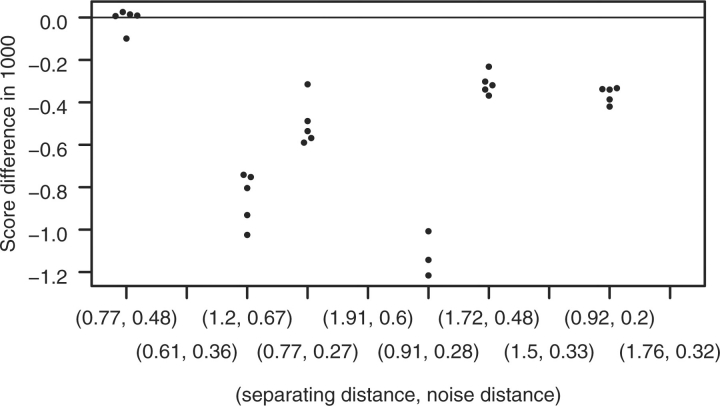
Fig. 6.
Results for the test setting preparing for the application with C.G being the original classification. On the vertical axis, (logP(D|GT)−logP(D|GO))·10−3 is given, with GT and GO, respectively, the most likely (reconstructed) ARG for C.02 and C.G, respectively. For more details (with the role of C.G and C.02 switched), see Figure 5.

