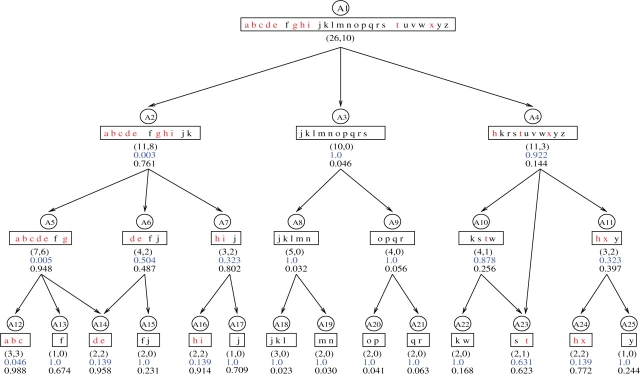
Fig. 1.
Comparison of the P-value and the B-score with an artificial DAG. The full list of genes (G) are denoted as lowercase letters; the genes in set S are marked in red. The rectangles contain the subset of genes annotated by each node, where (IA, nA) are listed under each rectangle. The hypergeometric P-values are listed in blue and the B-scores are listed in black underneath the P-values.

