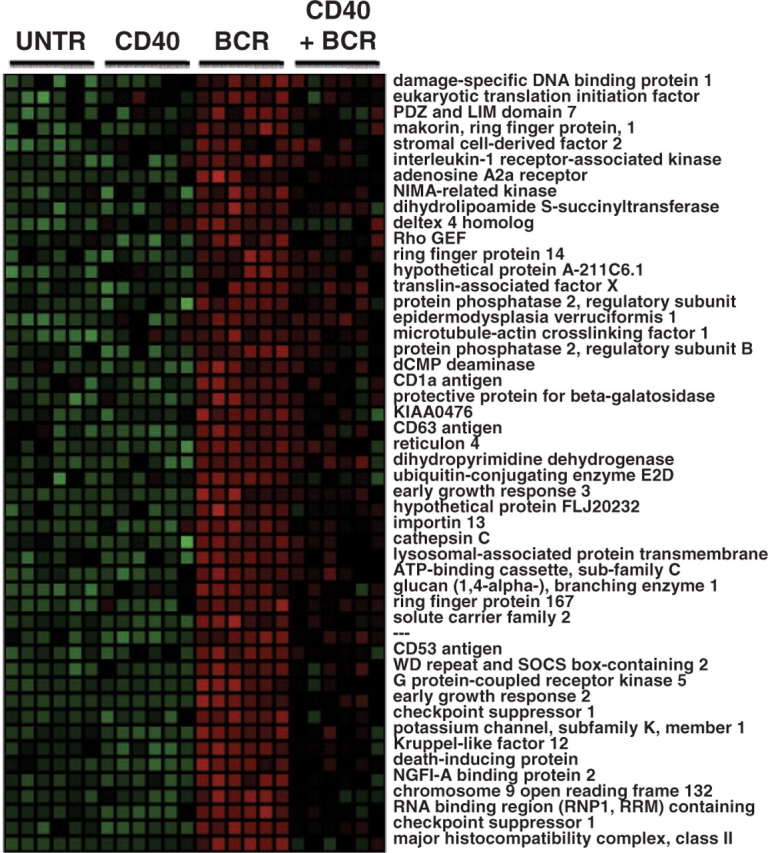
Fig. 2.

Gene expression pattern of Gene Cluster #7. A heat map of normalized expression values is shown in which green represents relatively low expression and red represents relatively high expression. Each column represents data from a single microarray. Six replicates from each of four experiment conditions were performed—untreated (UNTR), stimulation through the CD40 receptor (CD40), stimulation through the BCR and the combined stimulation. The expression pattern for a subset of 196 genes in GC#7 is shown.
