
Figure 2.
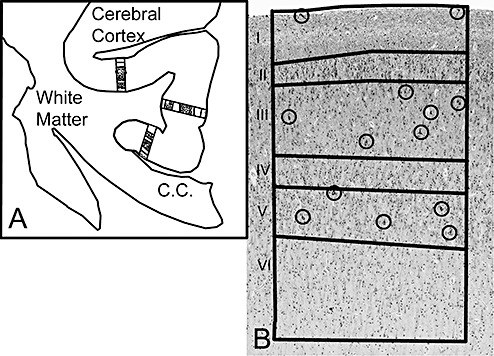
The Neurolucida software program (MicroBrightField) was used to quantify the density of layer I neurons and pyramidal neurons in layers III and V with MAP2 immunostaining in a two‐dimensional sampling column from the pial surface to the gray‐white border. A. We first selected the Brodmann area for study, as demonstrated in area 24 (cingulate gyrus). At low magnification (×40), we outlined the boundary of the entire section and then the boundary of the entire cortex in the section (Figure 1). Next, we defined three rectangular “boxes” of the cortex that were each 600 µm wide in the Brodmann area. B. Within this defined cortical region, the boundaries of the six cortical laminae were outlined, as illustrated in a representative control cases at 40 postconceptional weeks (term). Once the outlines were set in place, the selected neurons in layers I, III and VI were counted at high magnification (×200) in the MAP2‐immunostained section. The circles identify the neurons counted in each lamina of interest.