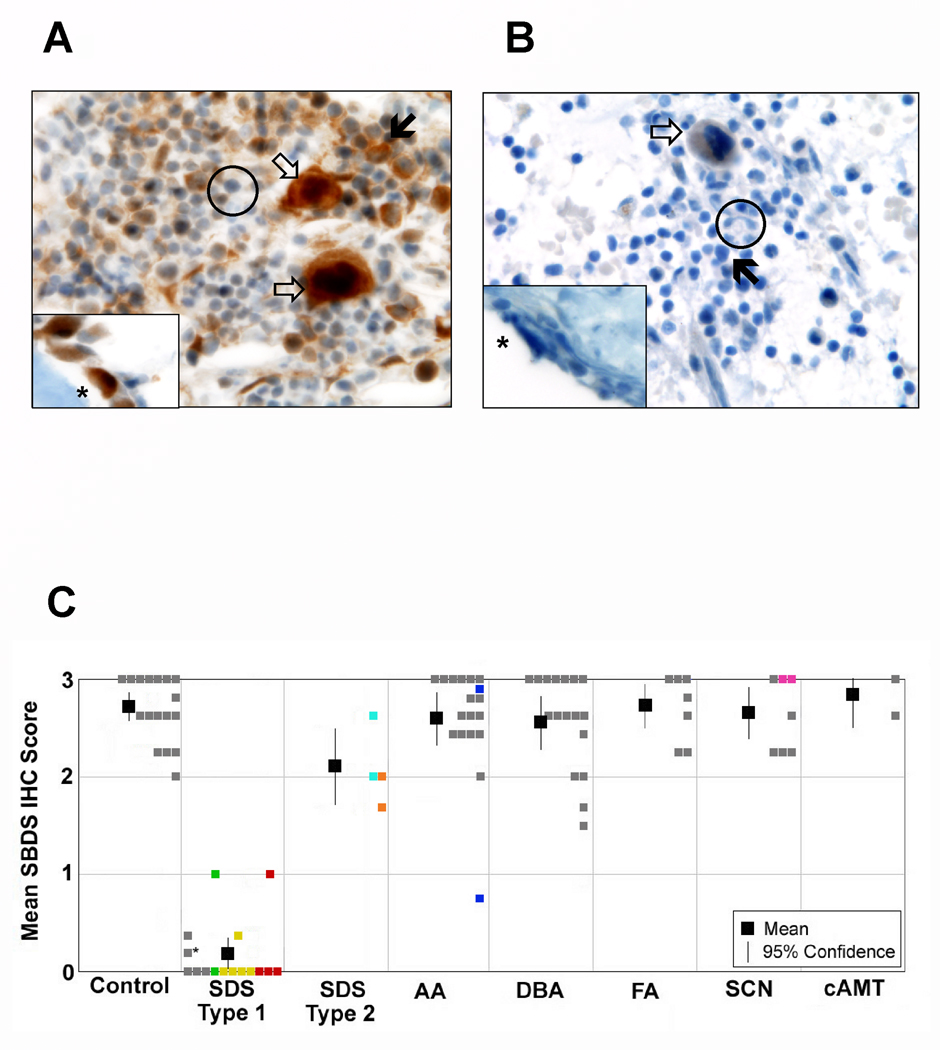
Figure 1.
SBDS protein expression in the bone marrow. A. Immunohistochemical staining for SBDS in a representative control BM biopsy (100X). B. Immunohistochemical staining for SBDS in a BM biopsy from a representative patient with SDS (100x). In both A and B, open arrow: megakaryocyte; closed arrow: neutrophil precursor; asterick: osteoblast; black circle: neutrophil. C. Mean SBDS immunohistochemical staining scored on a scale of 0 (weak) to 3 (strong). Grey boxes denote individual patient scores. Colored boxes represent multiple specimens from the same patient. Asterisk denotes the SDS patient without a confirmed mutation in SBDS. The mean immunohistochemical score for each diagnostic group is indicated by the black box and the 95% confidence interval is shown with the vertical bar.

