
Figure 7.
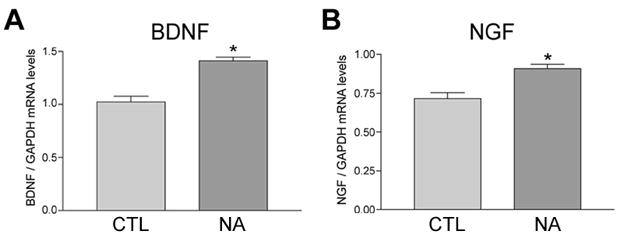
NA treatment increases BDNF and NGF mRNA levels in hNT neurons. A) Bar graph shows increased bdnf mRNA levels in hNT cultures following 1 hour of 10 μM NA, as measured by quantitative real-time PCR (qPCR) using human bdnf-specific primers. *, p < 0.05 vs. CTL. B) One hour of NA treatment also resulted in increased ngf mRNA levels in the hNT cultures. *, p < 0.05 vs. CTL; n = 3/treatment group in 3 independent experiments.