
Figure 5.
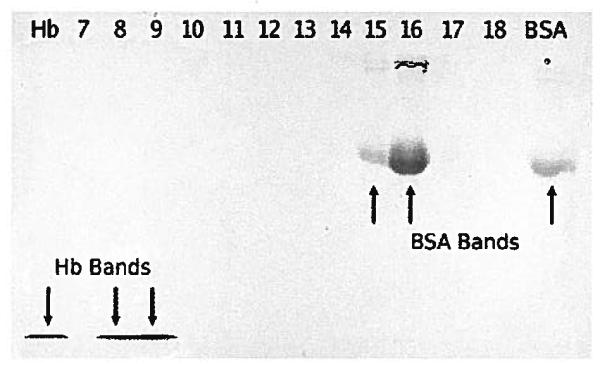
SDS-PAGE of samples from run 2. The top of the chamber, towards the left, contains the focused Hb in samples 8 and 9. Crude Hb is on the far left. The focused FITC-BSA was in samples 15 and 16 on the right of the gel and towards the bottom of the separation chamber. The right-most lane contains crude FITC-BSA.