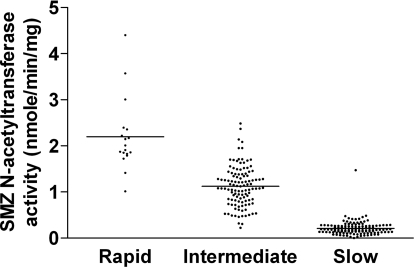
Fig. 2.
Scatter plot of SMZ N-acetyltransferase activities in cryopreserved human hepatocytes. Each dot represents SMZ N-acetyltransferase activity in each of the 256 human hepatocyte samples stratified by rapid, intermediate, or slow acetylator NAT2 genotype. Lines illustrate mean activity in each genotype.

