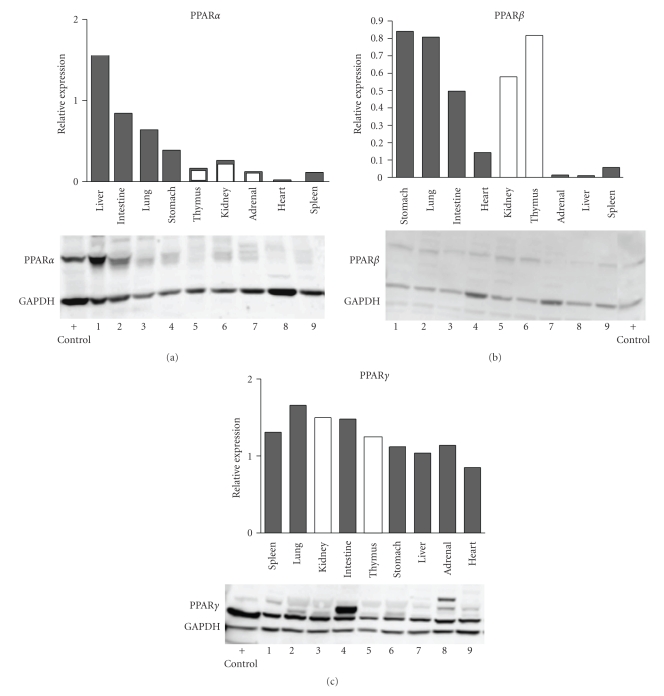
Figure 10.
Western blots are shown in which all 9 tissues are present on each blot. On the PPARα blot, all tissues shown by dark bars were from a single 91-day-old fetus, and adrenal and kidney (white bars) were from different 91-day-old fetuses, and thymus was from a 101-day-old fetus. The blots for PPARβ and PPARγ used samples from a 91-day-old fetus (dark bars, the same set of samples for both PPARβ and γ) with kidney and thymus samples (white bars) from different fetuses (91 and 108 days, resp.). Blot images are labeled to show the location of the PPAR band, the GAPDH band, and lane containing the positive control (Hep G2 whole cell extract, Jurkat cell nuclear extract, and U937 whole cell extract, for expression of PPARα, β, or γ, resp.). The densitometry data (PPAR expression normalized to GAPDH) for each gel is shown above the blot image. Lanes 1–9 contain the samples listed on the x-axis of the bar graphs.

