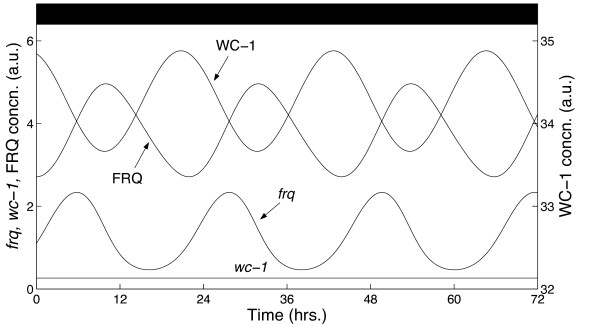
Figure 2.
Simulated mRNA and protein profiles in DD. The time series qualitatively match experimental data, yielding: i) an oscillation period close to 22 hrs; ii) constant wc-1 levels; and iii) a FRQ profile which oscillates in antiphase with WC-1, reaching peak levels shortly after its transcript [19,24-26,30].

