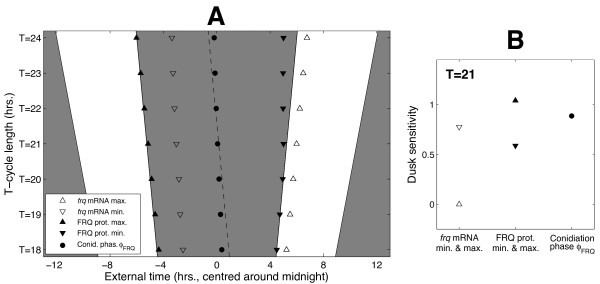
Figure 5.
The model reproduces the driven entrainment observed in photic T-cycles. A. Simulated variation of conidiation onset with photic T-cycle length. As in Figure 4, conidiation onset was identified with the FRQ falling phase ϕFRQ. Also plotted are the peak and trough times of frq mRNA and FRQ protein. White and grey regions denote light and dark respectively. The dotted line indicates a fixed period of time following dusk. B. Dusk sensitivities ∂ϕ/∂tDUSK of the phase measures shown in A for T = 21 (see Additional file 1, Figure S3 for the sensitivities over the full range of T-cycle lengths). ∂ϕFRQ/∂tDUSK is close to 1: conidiation onset therefore tracks dusk.

