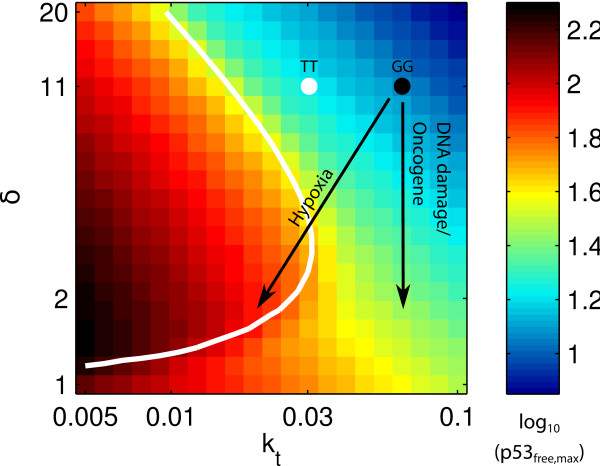
Figure 4.
Effect of the mdm2 SNP309. The color map and the white dot are the same as in Figure 2B-D. In the presence of the mdm2 SNP309 G allele, the resting state of the cell is shifted towards higher kt values, as indicated by the black dot. It is not known how much the SNP changes the kt value, but the qualitative behaviour can be predicted: the same stress will lead to a weaker response for GG than for TT.

