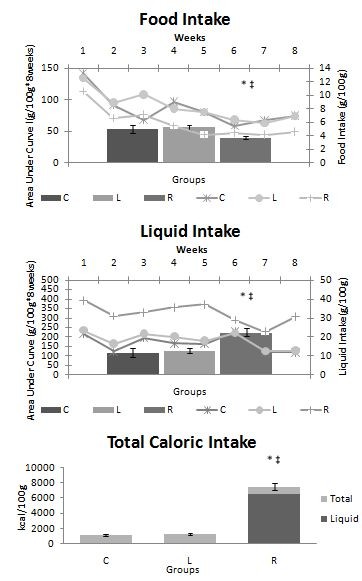
Figure 1.

Daily food and liquid intake. Daily food, liquid and caloric intake and area under the curve of food and liquid intake during the experiment. Food and water intake were measured and registered once a week. Caloric intake was estimated from the food intake. The results were analyzed by the calculated areas under the curves of food and liquid intake. C = Control; L = Light Soft Drink; R = Regular Soft Drink. n = 15 animals per group. * ≠ C. ‡ ≠ L.
