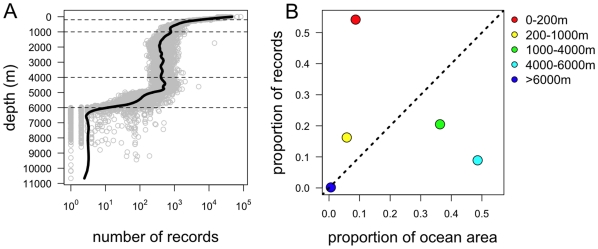
Figure 1. The depth distribution of OBIS records of global marine biodiversity.
A. Number of OBIS records against ocean depth (grey symbols); the general trend is illustrated with a lowess smooth (solid line). Horizontal dashed lines indicate the divisions into regions A-E defined by depth at 200, 1000, 4000 and 6000m (see Table 1). B. The proportion of all OBIS records occurring in the different depth zones identified in Table 1, against the proportion of the global ocean that occurs at those depths. The 1∶1 line identifies those areas of the ocean with proportionately more (points above the line) or fewer (points below the line) records than expected given their area. This gives a conservative view of under- and over-representation based on the volume of each habitat.

