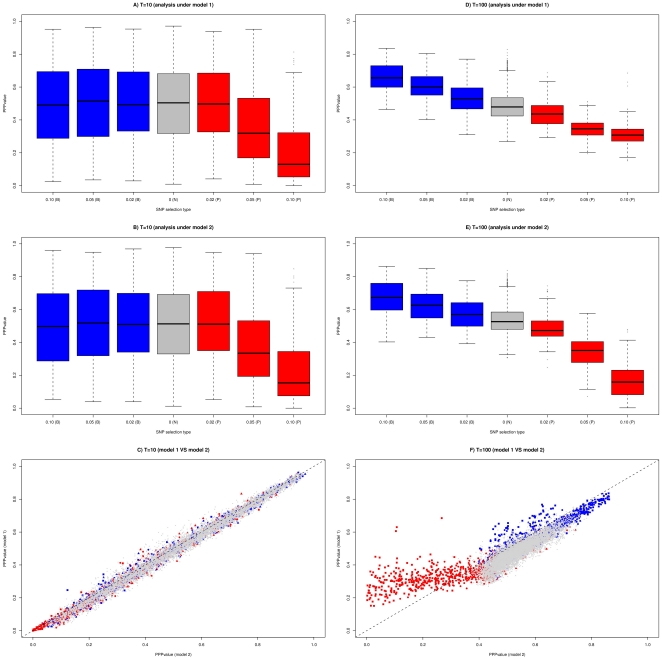
Figure 1. Distribution of the PPP-values estimates obtained with model 1 and model 2 for two data sets (T = 10 and T = 100) simulated under a pure-drift demographic scenario.
Each data set consists of genotyping data on 8 populations for 10,000 SNPs: 8,500 neutral SNPs (N), 3×250 SNPs subjected to positive selection (P) of varying intensity (s = 0.02, s = 0.5 and s = 0.10) and 3×250 = 750 SNPs subjected to balancing selection (B) of varying intensity (s = 0.02, s = 0.5 and s = 0.10). Boxplots of the PPP-values as a function of the type and intensity of selection are represented for data set simulated with T = 10 and analyzed with model 1 (A) and model 2 (B) and for data set simulated with T = 100 and analyzed with model 1 (D) and model 2 (E). C) and F) PPP-values estimated with model 1 are plotted against those estimated with model 2 for the data set simulated with T = 10 and T = 100 respectively. Neutral SNPs are plotted in grey while SNPs subjected to positive (respectively balancing) selection are plotted in red (respectively blue). In addition, the simulated coefficients of selection are represented by a triangle (s = 0.02), a circle (s = 0.05) or a square (s = 0.10).

